INTRODUCTION
Ecologists often examine patterns of functional trait diversity to investigate community assembly processes (Ackerly 2003; Kraft et al. 2015). To date, however, most trait-based approaches have focused on functional trait diversity within a single trophic level, often assuming competition as the dominant species interaction structuring communities (Weiher, Clarke, and Keddy 1998; Tilman 2004). In contrast, research in network ecology has extended trait-based community assembly across trophic levels. For example, studies demonstrated that trait matching across trophic levels plays a key role in the assembly of species interactions (Lavorel 2013) and the emergence of network structure (Allesina, Alonso, and Pascual 2008; Marjakangas et al. 2022; Saravia et al. 2022). However, despite the growing availability of species trait and distribution data across multiple trophic levels (Kissling et al. 2012; Schleuning, García, and Tobias 2023), our understanding of how assembly processes act within and between trophic levels jointly shape multitrophic communities remains limited (Guzman et al. 2019; Marjakangas et al. 2022).
Classical approaches to study community assembly rely on the concept of environmental filtering, where density independent conditions constrain the functional diversity of species assemblages (Laliberté and Legendre 2010; Villéger, Mason, and Mouillot 2008; HilleRisLambers et al. 2012; Kraft et al. 2015). Functional diversity is described through complementary measures such as functional richness (FR) and functional dispersion (FDis) (Mason et al. 2005, 2013). Functional richness is often used to estimate the strength of which environmental filtering constrains the morphological specialization of species assemblages. Functional richness typically measures the total variability of functional traits observed in a community. High functional richness can indicate weak environmental selection whereas low functional richness can indicate strong selection. Functional dispersion is often used to estimate the strength to which species partition the local trait space. Functional dispersion typically measures the degree of species clustering within a community trait space (Mason et al. 2005; Laliberté and Legendre 2010; Kraft and Ackerly 2010). High functional dispersion can indicate the coexistence of functionally distinct species, whereas low functional dispersion can indicate trait convergence (Kraft, Valencia, and Ackerly 2008; Halpern and Floeter 2008; Paine et al. 2011).
In a multitrophic context, where traits mediating species interactions (e.g. plant fruit size - animal body size) across trophic levels can also mediate the responses of species to gradients in their abiotic environment (e.g. water availability – temperature) (McCain and King 2014; Moretti and Legg 2009; Dehling, Barreto, and Graham 2022), the effects of environmental filtering can cascade to other trophic levels such that the environment filters on consumer traits can shape the functional richness or dispersion of their resources (and vice-versa) (Albrecht et al. 2018; Guzman et al. 2019). Moreover, the same environmental gradient could exert ecological pressures of different strength on communities at distinct trophic levels (Marjakangas et al. 2022). These differences may generate asymmetrical patterns of functional richness and dispersion between consumers and resources, modulated by their degree of reciprocal dependency or co-evolution (Medeiros, Garcia, and Guimaraes Jr 2018; Borzone Mas et al. 2026). These asymmetries could potentially shape large scale patterns of interaction assembly and possibly constrain the structure or topologies of trophic networks (Blüthgen, Menzel, and Blüthgen 2006; Schleuning et al. 2012; Saravia et al. 2022; Dehling, Barreto, and Graham 2022).
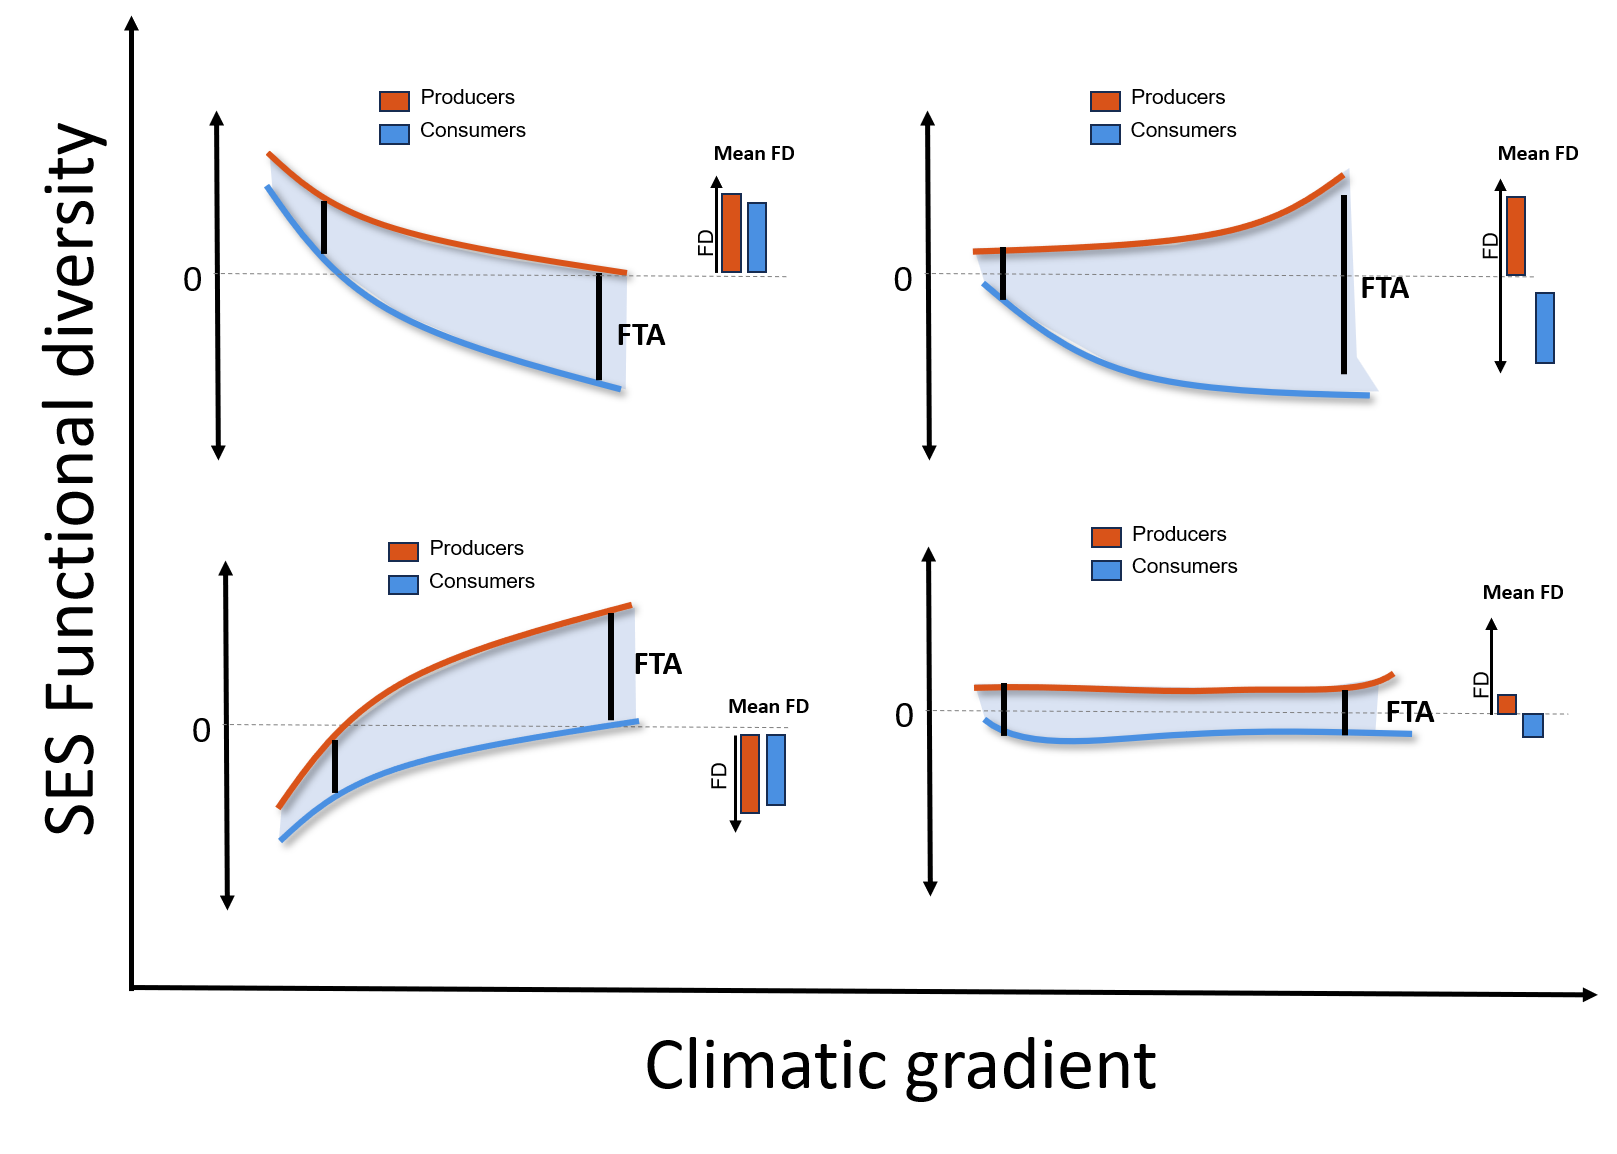
Here, we introduce the concept of functional trophic asymmetry (FTA), which allows inferring the difference of environmental filtering pressures on the functional diversity of multitrophic assemblages (Figure 1). FTA is the difference in standardized effect sizes (SES) of functional richness and functional dispersion between trophic levels. Because species traits jointly mediate trophic interactions (interaction niches) and responses to environmental conditions (environmental niches), FTA reflects asymmetries in the functional organization of trophic assemblages arising from both biotic and abiotic filtering. (McCain and King 2014; Moretti and Legg 2009; Dehling et al. 2021). As an example, plant seed size determines the outcome of animal-mediated seed dispersal (Donoso et al. 2017, 2020) as well as physiological limits, such as tolerances of plant seedlings to desiccation (Hoekstra, Golovina, and Buitink 2001). For functional richness, high FTA could indicate differences in the strength of environmental selection over the interaction niches of distinct trophic levels within a multitrophic species assemblage. Alternatively, low FTA could indicate that the strength of the environment selection shaping interaction niches is similar between trophic levels, e.g., equally weak or equally strong (Marjakangas et al. 2022). Low FTA could also emerge under strong trait matching and therefore indicate the influence of trait co-evolution during multitrophic community assembly (Dehling et al. 2021; Albrecht et al. 2018). For functional dispersion, FTA can be an indicator variation in the relative importance between trophic levels of processes promoting trait convergence or divergence, including niche differentiation and dispersal constraints (Fitzgerald et al. 2017; Bauer et al. 2021).
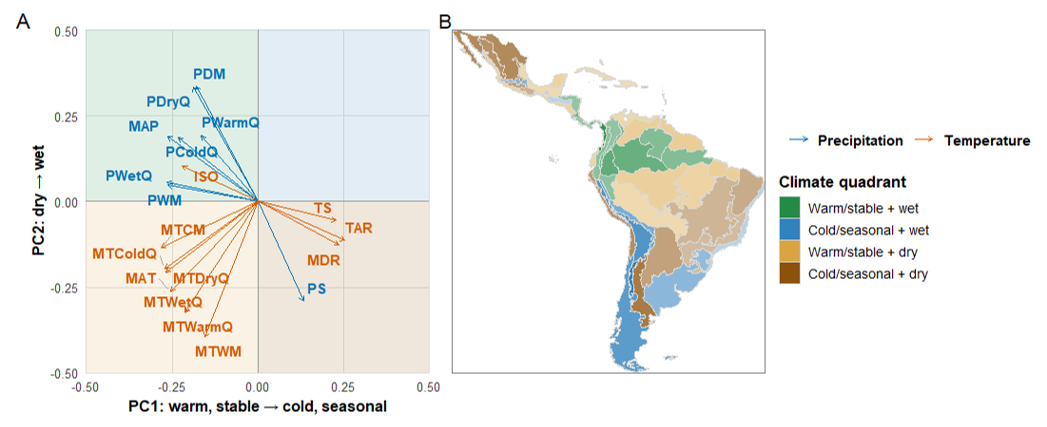
Mutualistic interactions between palms and their mammalian frugivores are important to sustain biodiversity and ecosystem function in tropical ecosystems (Bogoni, Peres, and Ferraz 2020; Marques Dracxler and Kissling 2022). Mammalian frugivores facilitate the dispersal of palm fruits, which helps to prevent local extinctions amid disturbance and to maintain biodiversity in these ecological networks (Acevedo-Quintero, Zamora-Abrego, and García 2020; Messeder et al. 2021; Dehling et al. 2021). To effectively preserve the structure of these interactions, it is crucial to understand how co-occurring palm (producer) and mammalian frugivore (consumer) communities will jointly respond to global climatic change. By examining the co-variation in their functional richness and functional dispersion across broad geographic scales and linking those patterns to spatial and/or temporal variation in climate (Figure 2), we identify the key climatic factors that may influence the assembly of their mutualistic relationships. Here, we ask (1) which climatic variable(s) best explain(s) geographic variation in the functional richness and dispersion of palms and mammalian frugivores, (2) whether differences in these relationships lead to FTA, and (3) which climatic variable best explains geographic variation in FTA across the Neotropics.
METHODS
Study system
We focused on multitrophic assemblages of Neotropical palms and their mutualistic, seed dispersing, mammalian frugivores. Palms (Plantae: Arecaceae) are a keystone plant family from tropical regions that provides fruit resources to a wide variety of vertebrate frugivores, including birds and mammals (Muñoz, Trøjelsgaard, and Kissling 2019; Zona and Henderson 1989). Frugivory-related traits have notably underlain palm diversification and played a key role in the evolution of palm traits (Onstein et al. 2014, 2017). Frugivorous mammals (Animalia: Mammalia) are among the most important palm-seed dispersers, particularly over long distances (Lim et al. 2020). Most frugivorous mammals feeding on palms are seed eaters and pulp eaters, dispersing palm seeds mostly via ectozoochorus dispersal (Messeder et al. 2021; Marques Dracxler and Kissling 2022).
Species occurrence data
We obtained binary species distribution data (presence/absence) of palms from the geographic range maps of (Bjorholm et al. 2005) and on mammals from the IUCN (International Union for the Conservation of Nature) data portal. We defined multitrophic assemblages across the Neotropics, by intersecting species-level range maps with Morrone (2014) delineation of neotropical biogeographic provinces. A species was considered present in a province when at least 5% of its occupied range cells occurred within that province, reducing the influence of marginal overlaps between species ranges and province boundaries. Species represented by fewer than ten occupied raster cells were excluded. This procedure was applied independently to palms and mammals, producing province-level presence–absence matrices for each trophic level.
Species trait data
We collected species-level traits associated with the environmental responses of palms and frugivorous mammals and with their mutualistic interactions. Trait selection was guided by two criteria: ecological relevance to palm–mammal assemblages and sufficient taxonomic coverage for analyses across the Neotropics.
For palms, we extracted growth form, maximum stem height, and average fruit length from the PalmTraits 1.0 dataset (Kissling et al. 2019). Growth form and maximum stem height describe major plant ecological strategies associated with forest structure, light availability, and climatic conditions, while also influencing the vertical accessibility of fruits to mammalian consumers. Fruit length represents a direct interaction trait because it constrains fruit handling and ingestion by mammals and therefore contributes to morphological matching between palms and frugivores.
For frugivorous mammals, we obtained body mass, % diet composition (fruit, nectar, seeds, other plant material, invertebrates, vertebrates, fish, scavenged material, and other/unknown resources), and daily activity data from the EltonTraits 1.0 database (Wilman et al. 2014). Diet was represented by the percentage use of each of the ten dietary categories provided in EltonTraits and was therefore included as a multivariate description of species’ trophic niches. We retained only species with non-zero fruit consumption. Daily activity was represented by the diurnal, crepuscular, and nocturnal activity categories, and body mass was expressed in kilograms. Together, these traits characterize complementary aspects of mammalian functional strategies: diet composition describes trophic specialization and dependence on plant resources, body mass influences metabolic requirements, movement and fruit-handling capacity, and activity period captures temporal differences in resource use and environmental exposure.
Diet in EltonTraits 1.0 is coded as the percentage use of ten dietary categories, and we excluded species with no fruit in their reported diet. Activity was represented by three categories—diurnal, crepuscular, and nocturnal—and body mass was expressed in kilograms. We excluded bats because few Neotropical bat species are known to consume palm fruits (Messeder et al. 2021). In total, our dataset included 494 palm species and 488 mammalian frugivore species with linked trait and geographic data, representing approximately 61% (Roncal et al. 2013; Balslev et al. 2015) and 64% (Fuzessy and Pizo 2025), respectively, of the species reported for the Neotropics. We used complete dietary profiles rather than fruit consumption alone because species with similar levels of frugivory may differ substantially in their use of other resources, reflecting differences in trophic specialization and potential dependence on palm fruits (Wilman et al. 2014).
Climatic data
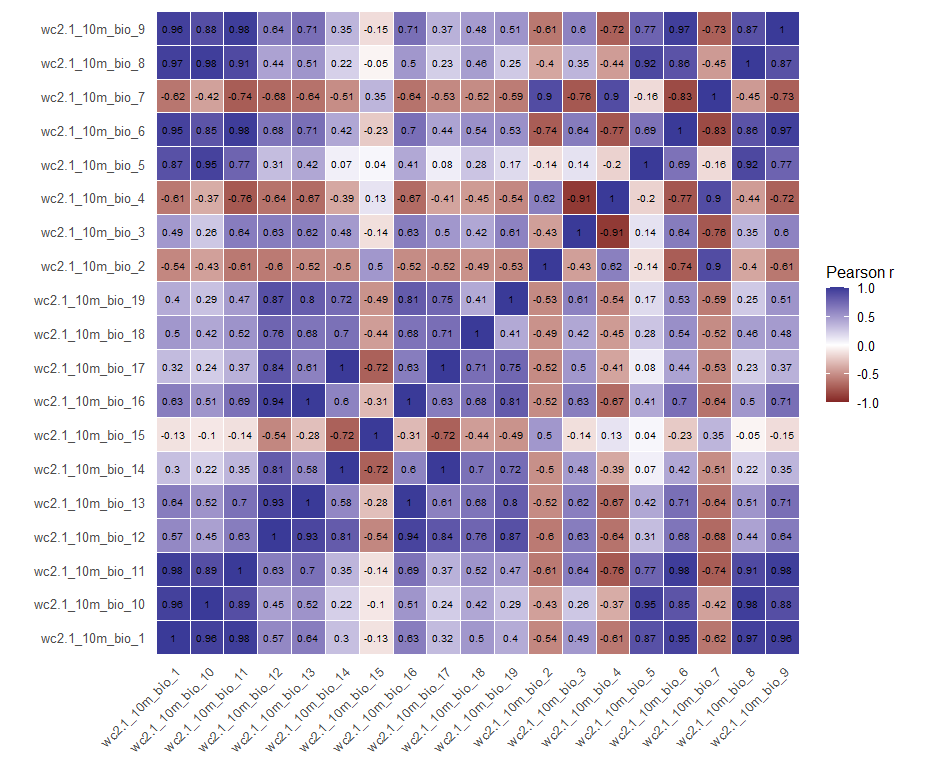
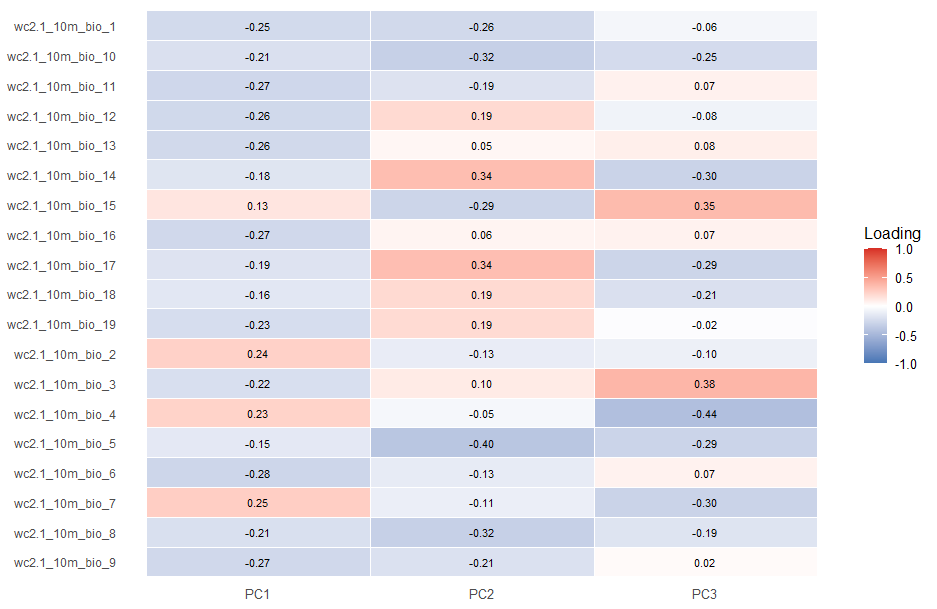
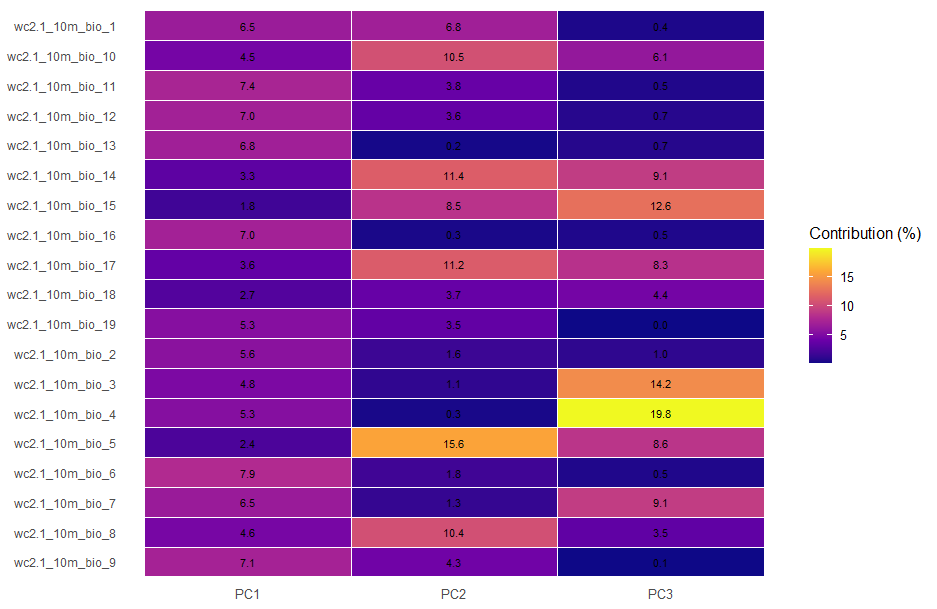
We used the 19 bioclimatic variables from WorldClim v2.1 (Fick and Hijmans 2017) to characterize large-scale climatic variation across Neotropical biogeographic regions ( Figure 2; Figure S1). For each region, we extracted the mean value of each bioclimatic variable by averaging raster cells contained within regional boundaries. To reduce dimensionality and account for collinearity among climatic predictors, we performed a principal component analysis (PCA) on the standardized bioclimatic variables (Figure S2). The first three principal components captured the dominant gradients of climatic variation across the Neotropics. PCA effectively summarized climatic variation across biogeographic regions into three principal components that together explained 87.9% of the total variance (Figure S3). PC1 (59.7%) described a gradient from warm, wet, and climatically stable environments (negative values) to cooler and more thermally seasonal climates (positive values). PC2 (19.3%) represented variation in dry-season moisture availability, ranging from hot climates with pronounced dry seasons (negative values) to climates with wetter dry periods (positive values). PC3 (8.9%) captured a transition from temperature-driven seasonality (negative values) to precipitation-driven seasonality (positive values) (Figure 2). These linear components were subsequently used as predictors in all analyses of functional diversity and functional trophic asymmetry.
Statistical analysis
Estimating functional diversity
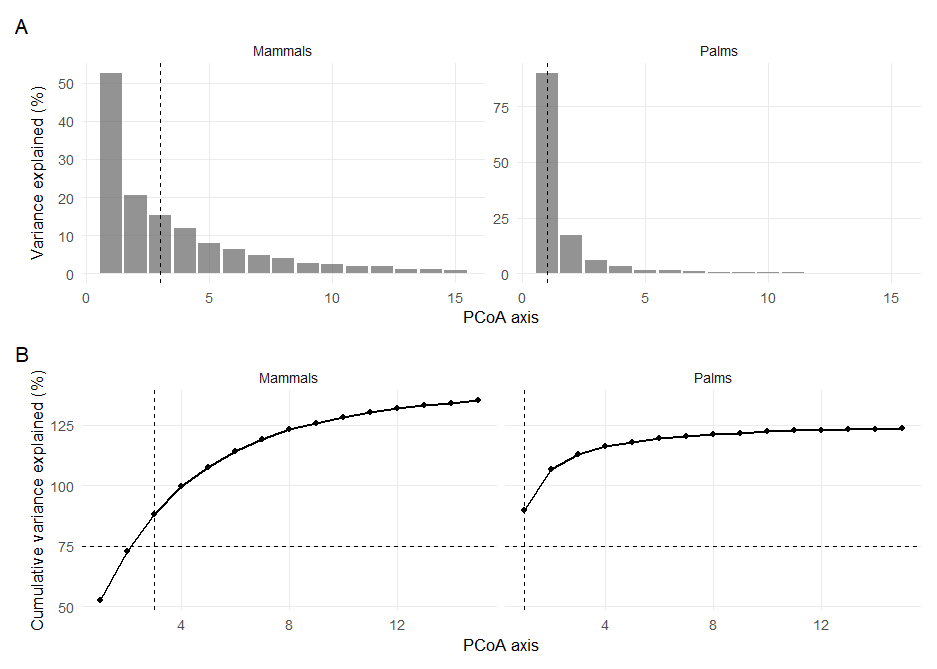
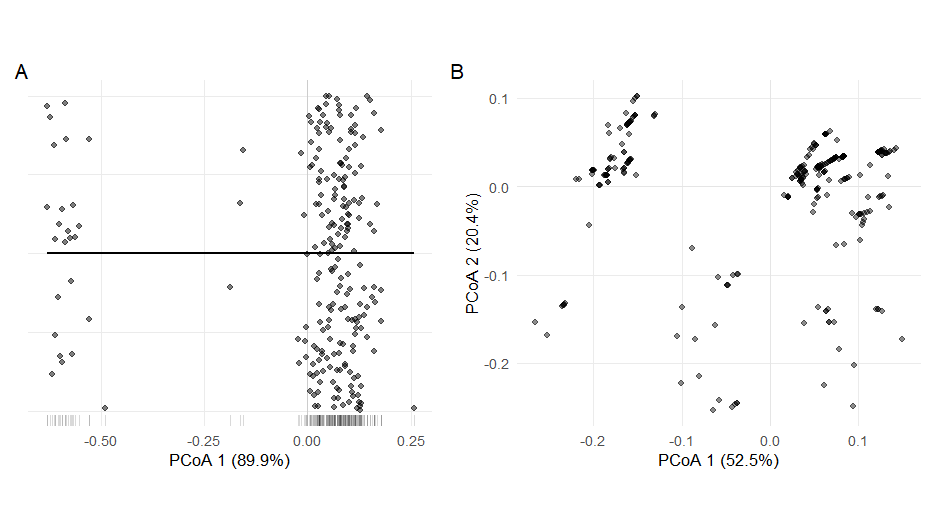
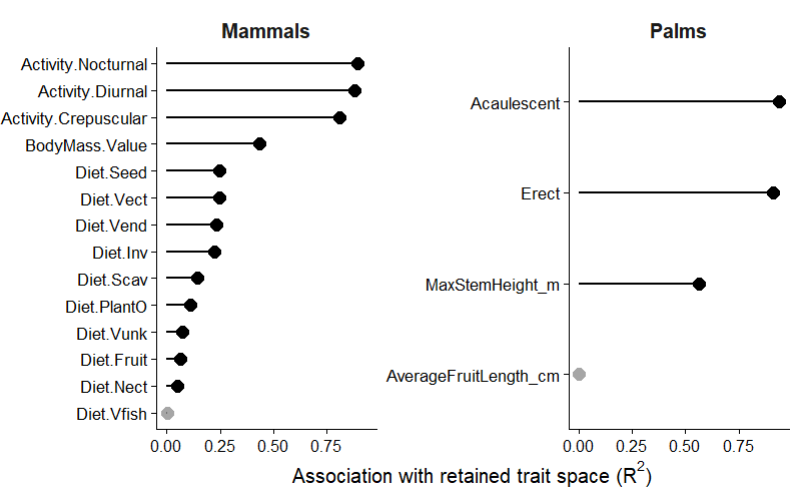
Functional diversity (FD) metrics were quantified from multidimensional trait spaces constructed independently for palms and mammals. Species-level functional dissimilarities were calculated using Gower distances to accommodate mixed trait types, and principal coordinates analysis (PCoA) was used to project species into continuous functional trait spaces (Figure S4). For each trophic level, we retained the minimum number of PCoA axes required to explain at least 75% of the total trait variation (Figure S5). In mammals, activity period and body mass were the primary determinants of trait-space structure, while stem height and growth form (erect vs. acaulescent) contributed most strongly to palm trait-space organization (Figure S6).
FD metrics were calculated from the subset of species present within a biogeographical province. For each assemblage, we quantified species richness, functional richness (FR) and functional dispersion (FDis). Functional richness (FR) measured the occupied volume of the local assemblage within the larger trait space of the continental pool. Functional dispersion (FDis) measured the clustering of species within trait space relative to the assemblage centroid (Laliberté and Legendre 2010). Metrics were calculated separately for palms and mammals using the FD package in R (Laliberté and Legendre 2010). Biogeographic assemblages containing fewer than three species of palms and mammals respectively were excluded from estimations.
We standardized each observed functional richness and functional dispersion metric against a richness-constrained expected metric values drawn from a distribution of null assemblages. For each palm and mammal assemblage, we generated 999 null assemblages by randomly selecting the same number of observed species from the continental species pool without replacement and recalculating FR and FDis at each permutation (Chase et al. 2011). Standardized effect sizes were calculated as the difference between the observed value and the mean null expectation, divided by the standard deviation of the null distribution. Positive SES values indicate increased trait volumes (FR-SES) or trait over-dispersion (Fdis-SES) ), whereas negative values indicate reduced trait-space volumes (FR-SES) and trait clustering (Fdis-SES).
Estimating FTA
We quantified functional trophic asymmetry (FTA) as the difference between mammal and palm standardized effect sizes (SES; \(FTA = SES_{mammals} − SES_{palms}\)). Therefore, FTA is measured from the overall functional trait space that shapes both interaction and environmental niches. Positive values indicate that mammal assemblages exhibit greater positive departures from null expectations than palm assemblages. For functional richness, this corresponds to mammals occupying a relatively larger volume of functional trait space than expected given species richness. For functional dispersion, positive values indicate that mammal assemblages are relatively more overdispersed (or less functionally clustered) than palm assemblages. Conversely, negative values indicate that palms exhibit greater positive departures from null expectations, reflecting relatively larger functional trait-space volume (FR) or greater functional overdispersion (FDis) than mammals.
Estimating the influence of climate in FD and FTA
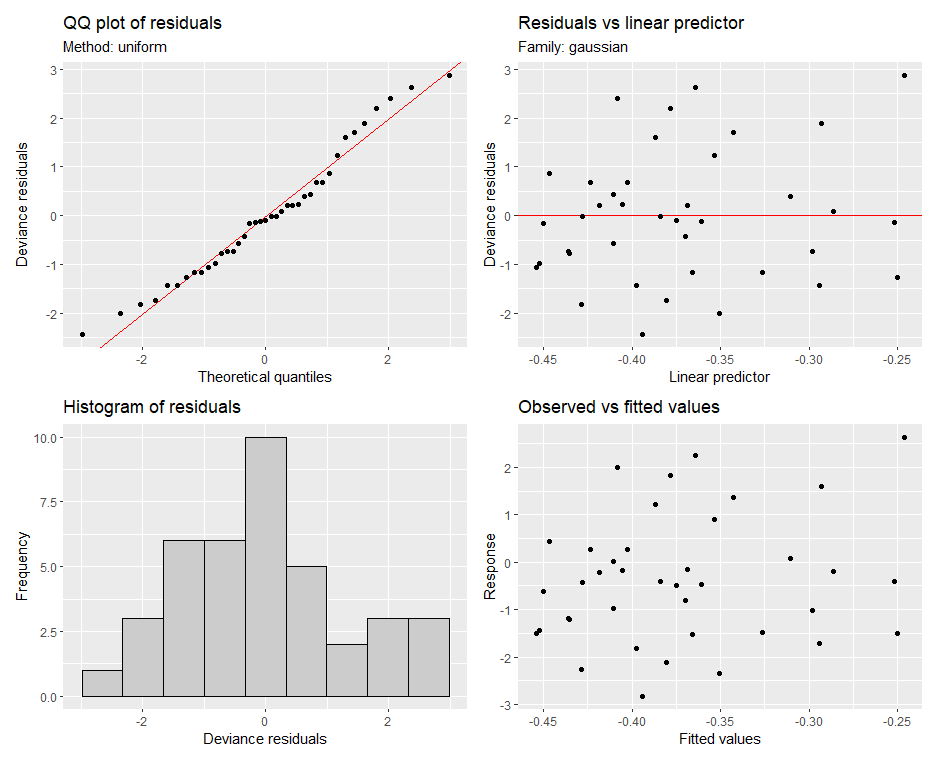
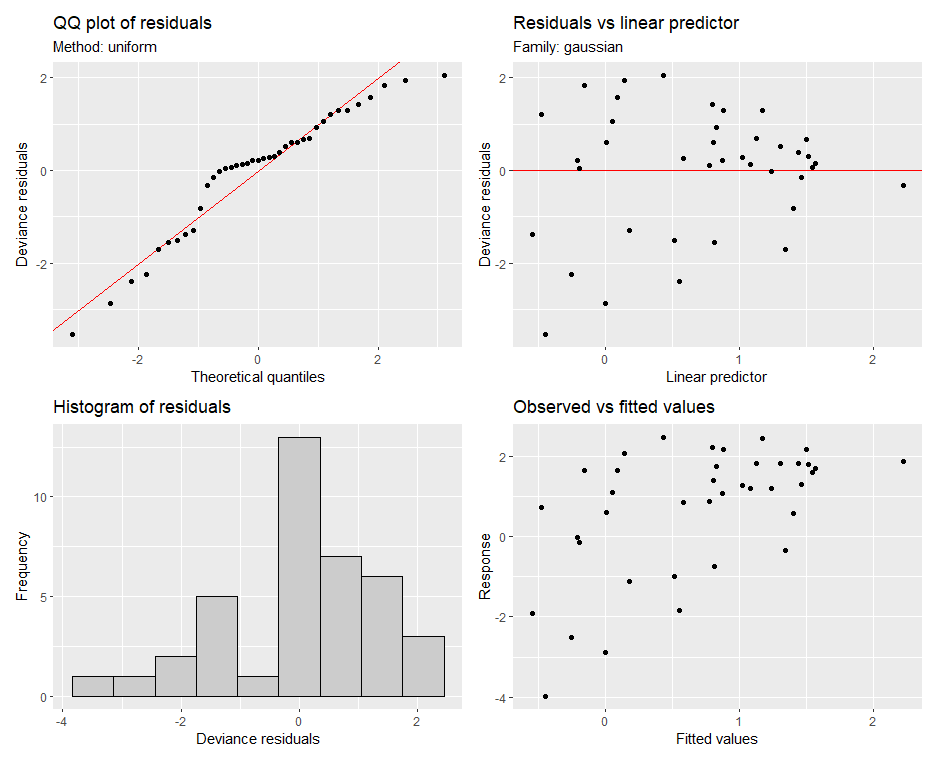
To assess climatic influences on functional trophic asymmetry, we fitted separate Generalized Additive Models (GAMs) using mgcv::gam (Wood and N 2017) with a Gaussian error distribution and identity link. Models included penalized thin-plate regression splines fitted independently for each climatic principal component \(FD = (s(PC1) + s(PC2) + s(PC3))\), and no tensor-product interactions were included because our objective was to estimate the marginal effects of each climatic gradient. Model adequacy was assessed using gam.check() together with visual inspection of residual-versus-fitted and normal QQ plots (Figures S7–S8). Diagnostics indicated no evidence of systematic residual patterns, heteroscedasticity, or inadequate basis dimensions.
RESULTS
Spatial distribution of trophic functional diversity and asymmetry
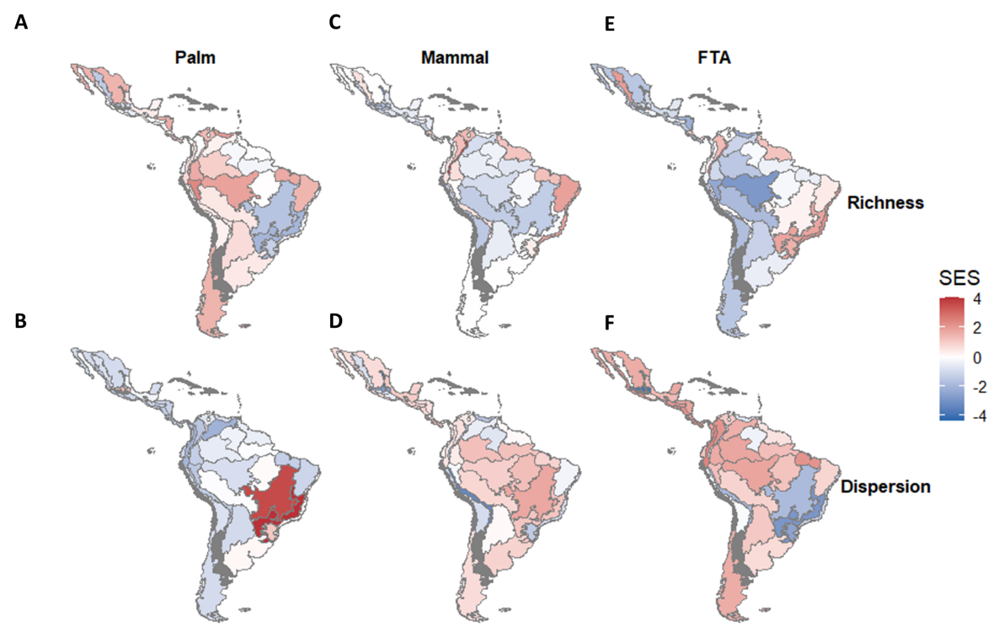
Functional diversity exhibited marked geographic variation across the Neotropics. Palm functional richness was generally highest in Central America and parts of eastern and southern South America (Figure 3 (A)), whereas mammal functional richness was highest in eastern Brazil but comparatively low across much of Amazonia and western South America (Figure 3 (B)). Consequently, functional trophic asymmetry in richness exhibited a pronounced west–east gradient (Figure 3 (C)), with palm assemblages exceeding mammal assemblages across much of Amazonia and mammal assemblages exhibiting relatively greater functional richness in eastern South America. Patterns of functional dispersion differed from those of richness. Palm functional dispersion peaked in southeastern Brazil (Figure 3 (D)), whereas mammal functional dispersion was elevated throughout much of tropical South America (Figure 3 (E)). Functional trophic asymmetry in dispersion displayed a distinct spatial pattern characterized by broadly positive values across much of the Neotropics but negative values concentrated in southeastern Brazil (Figure 3 (F)).
The influence of climate on the functional diversity of palms and mammals
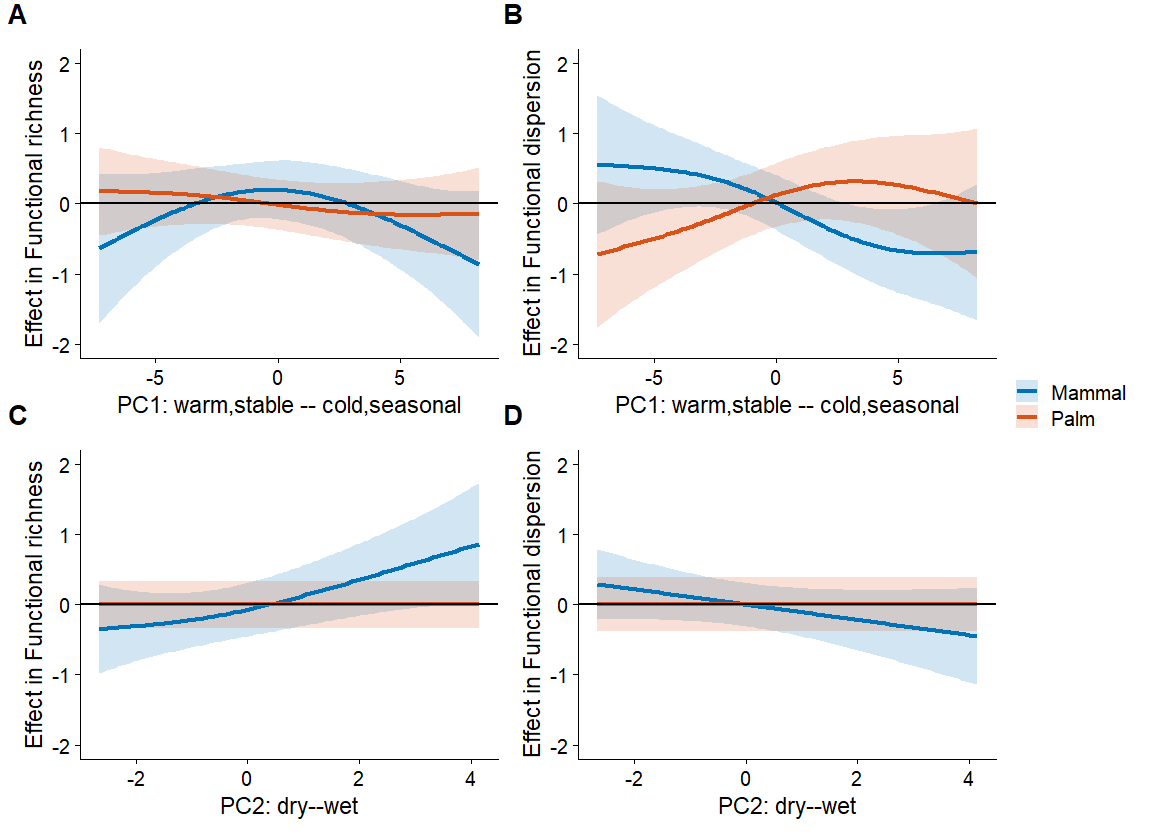
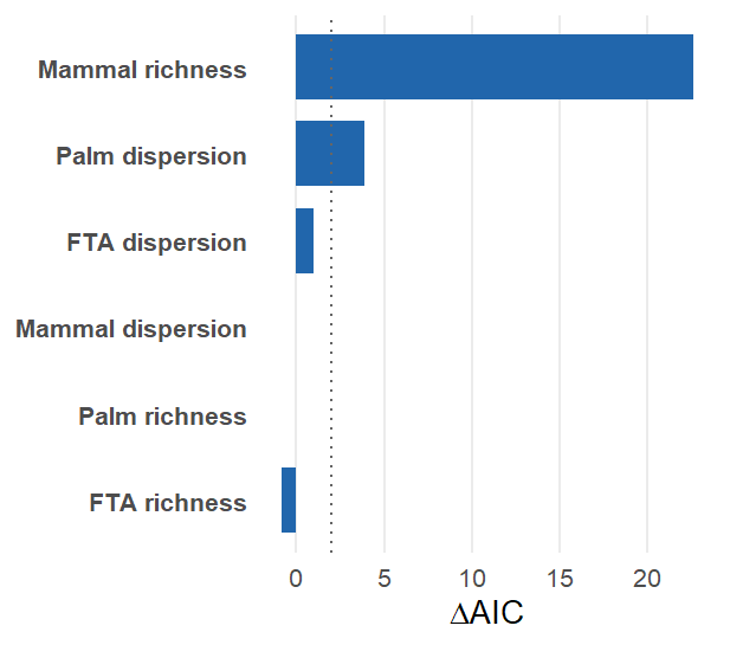
Precipitation seasonality and dry-season severity shaped mammal functional richness but had little influence on palm functional richness (Figure 4 (A-B), Table 1). Mammal SES functional richness was significantly associated with PC2, the moisture availability and dry-season intensity gradient (F = 1.23, P = 0.022), while PC1 showed a weak, non-significant trend (P = 0.101) (Table 1). The mammal model explained 19.8% of the deviance (adjusted R² = 0.140) (Table 2). In contrast, Palm SES functional richness showed no significant relationship with any climatic axis, with the model explaining only 4.1% of the deviance (adjusted R² = 0.025) (Tables 1, 2). Temperature seasonality, moisture availability, and climatic stability shaped mammal functional dispersion but had comparatively little influence on palm functional dispersion (Figure 4 (C-D), Table 1). Mammal SES functional dispersion was significantly associated with both PC1, the broad temperature–seasonality gradient (F = 1.99, P = 0.007), while PC2 showed a marginal effect (P = 0.071) (Table 1). The mammal model explained 32.2% of the deviance (adjusted R² = 0.265) (Table 2). In contrast, Palm SES functional dispersion showed only a weak, non-significant association with PC1, the temperature–seasonality gradient (F = 0.72, P = 0.091), while PC2 had no significant effects (Table 1). The palm model explained 14.4% of the deviance (adjusted R² = 0.098) (Table 2). Climatic gradients remained robust predictors of multitrophic functional diversity after controlling for biogeographical spatial structure (Figure S9). Specifically, model support remained virtually unchanged for palm functional richness, mammal functional dispersion (ΔAIC < 1). However, models of palm functional dispersion showed a modest improvement after accounting for space (ΔAIC = 3.85), whereas mammal functional richness exhibited a substantial increase in model support (ΔAIC = 22.6; deviance explained = 70.3%) (Table 2).
The influence of climate on functional trophic asymmetry
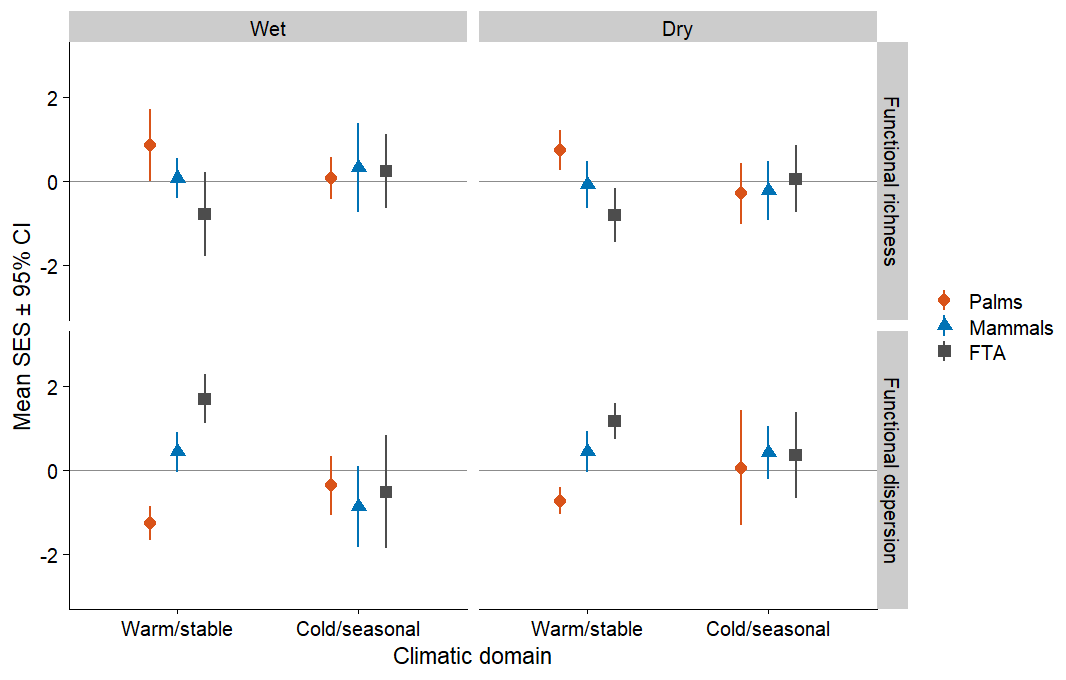
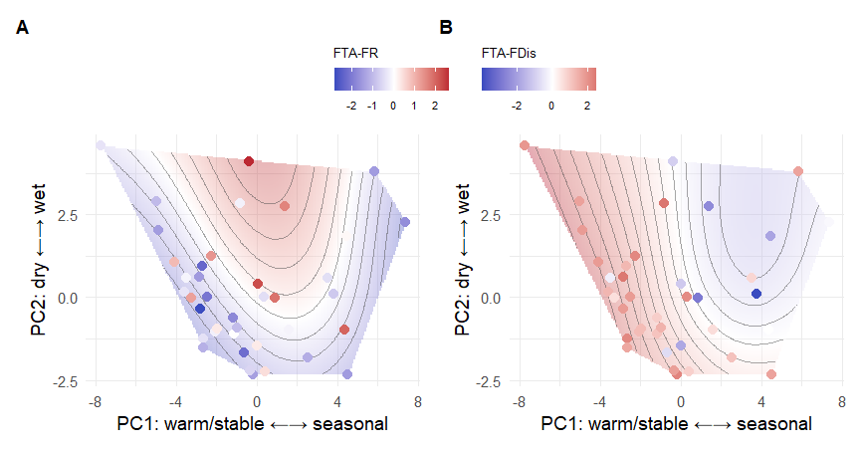
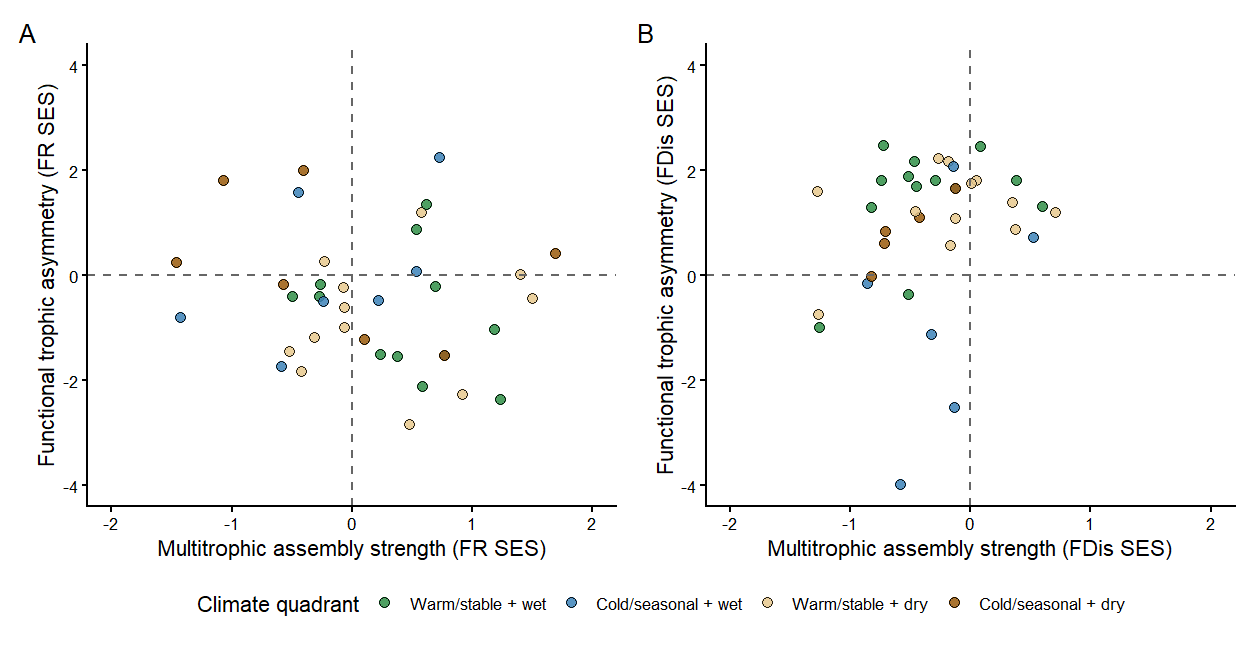
The influence of climate differed markedly between the two dimensions of functional diversity. Functional richness asymmetry exhibited little climatic structure, with no significant relationships along any climatic gradient and climate explaining only 1.4% of the deviance. Consistent with this result, mean standardized effect sizes for palms, mammals, and functional trophic asymmetry varied only modestly among climatic domains, with confidence intervals broadly overlapping zero (Figure 5). In contrast, functional dispersion asymmetry emerged because palms and mammals responded differently to the primary climatic gradient (PC1), which was the only significant predictor of asymmetry (F = 2.86, P = 0.002), explaining 29.4% of the deviance (adjusted R² = 0.243), whereas PC2 had no detectable effect (Figure S10; Table 1). In warm, climatically stable regions, palm assemblages were more functionally clustered than expected from null models (negative SES FDis), whereas mammal assemblages were more functionally overdispersed (positive SES FDis). These contrasting responses generated strong positive functional trophic asymmetry, indicating that consumers occupied a more evenly distributed functional space than producers under the same environmental conditions. By contrast, in colder and more seasonal climates, both trophic levels converged toward null expectations, reducing differences in their functional organization and causing functional trophic asymmetry to approach zero (Figure 5; Figure S11). Accounting for geographic structure had negligible effects on either functional trophic asymmetry metric (ΔAIC < 1; Figure S7).
Estimated degrees of freedom (EDF), F-statistics, and associated P-values for smooth terms relating the first three climatic principal components (PC1–PC3) to functional richness (FRic), functional dispersion (FDis), and functional trophic asymmetry (FTA). Climatic effects were generally weak for richness-based metrics, with only mammal FRic showing a significant association with PC2. In contrast, dispersion-based metrics exhibited stronger climatic relationships, particularly for mammal FDis, which was significantly associated with PC1 and PC3, and FTA FDis, which showed a significant association with PC1. Estimated degrees of freedom close to zero indicate little support for nonlinear responses along the corresponding climatic gradient.
| Response | PC1 | PC2 | PC3 | ||||||
|---|---|---|---|---|---|---|---|---|---|
| edf | F | P | edf | F | P | edf | F | P | |
| Palm FRic | 0.60 | 0.25 | 0.201 | 0.00 | 0.00 | 0.441 | 0.00 | 0.00 | 0.623 |
| Palm FDis | 1.19 | 0.72 | 0.091 | 0.00 | 0.00 | 0.363 | 0.73 | 0.34 | 0.159 |
| Mammal FRic | 1.43 | 0.83 | 0.101 | 1.17 | 1.23 | 0.022 | 0.00 | 0.00 | 0.634 |
| Mammal FDis | 1.45 | 1.99 | 0.007 | 0.69 | 0.55 | 0.071 | 0.81 | 1.06 | 0.028 |
| FTA FRic | 0.00 | 0.00 | 0.399 | 0.24 | 0.08 | 0.260 | 0.00 | 0.00 | 0.979 |
| FTA FDis | 1.65 | 2.86 | 0.002 | 0.92 | 0.40 | 0.166 | 0.00 | 0.00 | 0.927 |
DISCUSSION
Our study reveals that functional traits relevant to the assembly of mutualistic interactions between producers (palms) and their consumers (mammalian frugivores) are differentially filtered by climate across trophic levels and geographic regions of the Neotropics. Climatic gradients exert substantially stronger effects on mammalian than palm functional diversity, with both temperature/seasonality (PC1) and moisture regime (PC2) jointly determining where functional trophic asymmetries emerge. The strongest asymmetries occurred in biogeographic regions with warm, climatically stable environments. However, its direction depended on moisture availability. In warm/stable, dry regions, mammalian assemblages were relatively more functionally dispersed than palm assemblages, whereas in warm/stable, wet regions the opposite pattern emerged, with palms exhibiting greater functional dispersion. By contrast, functional trophic asymmetry was comparatively weak across cold/seasonal climatic domains.
The influence of climate on FTA
Functional trophic asymmetry emerged because climate influenced mammal functional diversity more strongly than palm functional diversity, with stronger effects on functional dispersion than on functional richness. The stronger climatic signal for mammalian functional dispersion is consistent with previous observations of ecological packing in species-rich tropical assemblages, where warm, productive and climatically stable environments promote the coexistence of functionally similar species (Kraft et al. 2015; Safi et al. 2011; González-Maya et al. 2017). Increased packing of consumer functional space is expected to increase overlap in potential interaction niches, allowing multiple mammal species to exploit similar sets of palm resources. Consequently, contemporary climate may reshape the organization of mutualistic interactions primarily by reorganizing consumer functional space rather than by changing the breadth of ecological strategies available for palm seed dispersal. The comparatively weak climatic response of palm functional diversity suggests that producer functional traits are buffered against contemporary climatic filtering. Mammalian functional traits may respond more rapidly to energetic constraints and resource availability (Boratyński 2021; Brandl et al. 2023), whereas palm functional traits are likely constrained by longer generation times and stronger historical legacies. This interpretation is consistent with evidence that present-day palm assemblages retain a strong imprint of past climatic conditions, reducing their sensitivity to contemporary environmental gradients (Kissling et al. 2012; Göldel, Böhning-Gaese, and Schleuning 2015).
Model performance is summarized by the percentage of deviance explained, adjusted R², Akaike Information Criterion (AIC), and the change in AIC following the inclusion of spatial structure (ΔAIC). Positive ΔAIC values indicate support for including spatial predictors, whereas negative values indicate no improvement over climate-only models.
| Response | Deviance explained (%) | Adjusted R² | AIC | ΔAIC |
|---|---|---|---|---|
| Palm FRic | 4.1 | 0.025 | 118.07 | -0.38 |
| Palm FDis | 14.4 | 0.098 | 131.60 | 0.44 |
| Mammal FRic | 19.8 | 0.140 | 120.03 | 1.75 |
| Mammal FDis | 32.2 | 0.265 | 115.30 | 7.68 |
| FTA FRic | 1.4 | 0.008 | 136.89 | -0.27 |
| FTA FDis | 29.4 | 0.243 | 143.56 | 6.69 |
The potential consequences of FTA for ecological network assembly
Differential climatic responses across trophic levels may have important consequences for the assembly and persistence of ecological interactions. Because mutualistic interactions emerge through trait matching between producers and consumers, the ecological consequences of functional trophic asymmetry are likely to depend on the degree to which interactions are constrained by compatible trait combinations (Dehling et al. 2021; Bartomeus et al. 2016; Albrecht et al. 2018; Armbruster, Pélabon, and Hansen 2014). Consequently, the effects of regional functional trophic asymmetry in the assembly of local networks should depend on the capacity of species in the community to establish novel interactions (Marjakangas et al. 2022). Where interactions are flexible, changes in consumer functional composition may be accommodated through partner switching, allowing networks to reorganize while maintaining overall connectivity (Caradonna, Bain, and Waser 2021). In contrast, where interactions depend on a narrow range of compatible trait combinations, asymmetric changes in producer and consumer functional diversity may reduce the availability of suitable partners, increasing the risk of interaction loss and secondary extinctions (Schleuning et al. 2012; Schleuning, Fründ, and García 2015; Gillespie et al. 2024). Functional trophic asymmetry may therefore help identify regions where climatic change is most likely to reorganize ecological networks (Classen et al. 2020), providing a functional link between environmental filtering, trait matching, and the assembly of multitrophic networks (Marjakangas et al. 2022).
An important next step is to evaluate whether functional trophic asymmetry predicts the organization of empirical ecological networks (Classen et al. 2020; Opedal and Hegland 2020; Yahaya et al. 2024). Although our framework infers potential interaction niches from species traits and distributions, the increasing availability of standardized regional interaction datasets (metawebs) Caron et al. (2022)] provides an opportunity to test whether regions with greater functional trophic asymmetry exhibit predictable differences in network architecture, including specialization, modularity, connectance, and robustness to species loss (Montoya and Raffaelli 2010; Schleuning, Fründ, and García 2015; Schleuning, García, and Tobias 2023) Such tests would determine whether asymmetries in producer and consumer functional diversity translate into realized differences in network structure and ecosystem functioning (Schleuning, Fründ, and García 2016; Strydom et al. 2022). Extending this framework by projecting synthetic interaction networks to local assemblages using species abundances, habitat suitability, dispersal constraints, and local environmental conditions (Banville et al. 2024; Beumer et al. 2025) would allow direct evaluation of how functional trophic asymmetry influences the assembly of ecological networks across spatial scales (Galiana et al. 2018; Ponisio et al. 2019; Thuiller et al. 2024). Similarly, future applications could incorporate ecologically informed null models that preserve additional properties of assemblages (e.g., phylogenetic structure, environmental constraints, dispersal, or interaction rules), allowing FTA to disentangle alternative assembly mechanisms with greater specificity (Marjakangas et al. 2022).
Functional trophic asymmetry as a multitrophic indicator of ecological processes and their response to global changes
Our findings suggest that climatic filtering is one mechanism generating functional trophic asymmetry, but climate is unlikely to be the only driver. Habitat loss, defaunation, biological invasions, and other forms of anthropogenic environmental change can independently alter the functional composition of producers or consumers, potentially increasing or reducing asymmetry between trophic levels (Tinoco et al. 2018; Guevara, Torres, and Graham 2023b, 2023a; Bello, Schleuning, and Graham 2023; Guerra et al. 2025). Indeed, a growing body of evidence shows that anthropogenic disturbances often affect trophic levels asymmetrically, with consumer communities, particularly large vertebrates, experiencing greater functional losses than producers (Duffy and E 2003; Hogsden, Xenopoulos, and Rusak 2009; Dirzo et al. 2014). Functional trophic asymmetry provides a framework for quantifying these differential responses and comparing how diverse environmental drivers reshape the relative functional organization of interacting trophic levels. By extending trait-based approaches beyond individual trophic levels, FTA offers a common framework for investigating how environmental change propagates through multitrophic communities and ultimately influences the organization of ecological interactions.
Climate strongly structured functional dispersion asymmetry but had comparatively little influence on functional richness asymmetry. This contrast suggests that the two dimensions of functional trophic asymmetry differ in their sensitivity to contemporary climatic filtering. Because functional trophic asymmetry was evaluated across biogeographic provinces, the comparatively weak climatic signal for functional richness asymmetry indicates that province-specific historical processes may also contribute to regional differences. Biogeographic provinces integrate long-term histories of diversification, extinction, and dispersal that shape the regional pool of functional strategies available to interacting trophic levels. Functional richness asymmetry may therefore be more strongly influenced by these historical legacies, whereas functional dispersion appears more responsive to present-day environmental conditions.
This interpretation is consistent with previous studies showing that historical and contemporary processes often contribute differently to patterns of functional diversity. For example, Quaternary climatic history exerts a strong influence on plant functional diversity (Ordonez and Svenning 2017), whereas contemporary climatic gradients more strongly structure functional diversity in woody plants and mammals (Swenson et al. 2012; Hedberg and Smith 2025). Other systems exhibit the opposite pattern. For instance, global freshwater fish assemblages show stronger historical controls on functional dispersion but stronger contemporary controls on functional richness (Su et al. 2022), illustrating that the balance between historical legacies and contemporary environmental filtering varies among taxa. Functional trophic asymmetry therefore provides a framework for investigating how historical eco-evolutionary processes and contemporary environmental filtering jointly shape the functional organization of interacting trophic levels.
CONCLUSION
As climate change alters precipitation regimes, dry-season intensity, and climatic stability, functional trophic asymmetry is likely to change across Neotropical palm–frugivore assemblages. Because climate and other global change drivers can differentially affect producer and consumer functional diversity, they may reshape potential interaction niches and the functional organization of ecological networks, particularly where opportunities for interaction rewiring are limited (Tylianakis et al. 2008; Caradonna, Bain, and Waser 2021; Cruz, Souza, and Rosumek 2023). Functional trophic asymmetry therefore provides a framework for generating and testing predictions about how differential functional responses across trophic levels influence the reorganization of ecological networks under environmental change. Evaluating these predictions across diverse ecosystems will establish the generality of functional trophic asymmetry as an indicator of multitrophic responses to global change (Acosta-Rojas et al. 2023; Nowak et al. 2022; Landim et al. 2025; Rabeau et al. 2025). By extending trait-based approaches beyond individual trophic levels, FTA is a general multitrophic framework that links broad-scale environmental filtering to the functional organization of ecological networks.
SUPPLEMENTARY MATERIAL
 {#fig-S7}
REFERENCES
REVISION HISTORY
FTA definition: FTA is central to your article, but there are inconsistencies in how it is defined. At L108–109 you define FTA as the difference in the richness of interaction-relevant traits between trophic levels. However, in the Methods (L189–191) you include both interaction-relevant traits and traits related to physiological tolerance to the abiotic environment. In the Discussion (L481), you again refer only to traits relevant to trophic interactions. This creates confusion. If FTA is meant to be based solely on interaction-relevant traits, then the trait set should be restricted accordingly. If environmental-tolerance traits are intentionally included, the definition of FTA should be revised to reflect this broader scope. In either case, please clarify and justify the trait selection.
We have revised the definition of functional trophic asymmetry throughout the manuscript to clarify that FTA is quantified from the standardized functional diversity of trophic assemblages based on traits that collectively capture both species’ interaction niches and their responses to the abiotic environment. We also added a brief justification of trait selection in the Methods and ensured consistent terminology in the Introduction, Methods, and Discussion.
Briefly describe the dietary categories in brackets for clarity.
Dietary categories are described in brackets
It would be valuable to test the predictions of your downscaling approach by comparing the metaweb-derived networks with some available local networks to evaluate how well the downscaled structure matches empirical data. If validation is not feasible, please acknowledge this limitation in the Discussion—one or two sentences would be sufficient.
The downscaling component because it is being developed as a separate methodological paper dedicated to interaction network downscaling and validation. As a result, this point is no longer directly applicable to the scope of the present study.
“This normalization ensures that our measure reflects trait diversity rather than simply species richness.” I struggle to understand this normalization step. You state that dividing by species richness (i.e., using proportions of species per guild) removes the effect of species richness, but it is unclear how this operation actually isolates functional richness. Could you clarify this?
The downscaling component because it is being developed as a separate methodological paper dedicated to interaction network downscaling and validation. As a result, this point is no longer directly applicable to the scope of the present study.
“We assigned a value of FR = 0 to those guilds with no palm or mammal species present.” What is the purpose of including these zeros?
The interaction-guild framework has been removed from the manuscript. In the revised version, functional richness and functional dispersion are calculated directly from the producer and consumer trait spaces rather than from latent interaction guilds. As a result, this point is no longer directly applicable to the scope of the present study.
FTA is calculated as an absolute difference. Would it make sense to also consider a directional difference? Biologically, having higher functional diversity in consumers than in producers is not equivalent to the opposite case, so the sign may carry meaningful information.
We agree that the direction of the difference carries important biological information. Accordingly, we revised the definition of functional trophic asymmetry (FTA) to use a signed difference rather than an absolute difference, allowing us to distinguish cases where functional diversity is greater in mammal assemblages from those where it is greater in palm assemblages. We updated the definition, equations, conceptual figure, and all corresponding interpretations throughout the manuscript to reflect this change. In addition, we included a complementary analysis in the Supplementary Material (Figure S-11) showing how FTA can be interpreted jointly with the mean standardized effect size across trophic levels, allowing the direction and magnitude of asymmetry to be distinguished from changes in the overall level of functional diversity.
GAM models (L357–361, 371–376): More detail is needed. Which function and package did you use (e.g., mgcv::gam)? Which family and link function? Did you use tensor interactions? Which diagnostic checks did you run (e.g., gam.check, k.check, gratia, residual diagnostics)?
We expanded the Methods to provide additional details on the GAM implementation, including the function and package used (mgcv::gam), the error distribution and link function, the specification of the smooth terms, and the absence of tensor-product interactions. We also clarified the diagnostic procedures used to evaluate model adequacy, including gam.check() and visual inspection of residual diagnostics.
(Table S1): The reported R² values are essentially zero, and some appear negative—please verify this. With such low explanatory power, the interpretability of predictor effects is unclear; significant p-values may simply reflect the large sample size. Also, estimates are reported for abiotic variables but not for guilds—only p-values are shown. Please revise.
Rather than analysing 1° grid cells (as the previous version), all functional diversity metrics are now calculated at the level of biogeographic provinces, which represent the ecological units of inference in this study. This resulted in substantially improved model performance, with higher explained variance and clearer relationships between climatic predictors and functional diversity. Accordingly, the previous concerns regarding near-zero R² values and the interpretation of significant effects due to large sample size are no longer applicable. In addition, the previous interaction-guild framework has been removed from the manuscript, and Tables have been revised to reflect the new analytical approach and model outputs.
Decimals and reporting consistency: Please check for consistency in decimal places throughout the manuscript. It would be better to use a fixed number (e.g., two or three) and report very small p-values as p < 0.001. The manuscript currently mixes formats (e.g., four decimals at L429, three at L422, two at L453). In L460 and L477 you report p > x; please report the actual p-values instead.
We have carefully revised the manuscript to standardize the reporting of numerical values throughout. Decimal places are now reported consistently, very small p-values are presented as p < 0.001, and exact p-values are reported where appropriate instead of expressions such as p > x.
Figures: The figures are informative, but please consider using a colour-blind–safe palette to distinguish producers and consumers. The current colours are difficult to differentiate for colour-blind readers.
Figure 1 (L603–606): I would remove this section. The caption contains more information than necessary, and streamlining would save words without reducing clarity.A similar level of streamlining across all figure captions would benefit the manuscript. I recommend keeping only the minimum information needed to understand each figure and moving the remaining details to the main text.
We have updated the main figures to use a colorblind-friendly blue–orange–gray palette and distinct point shapes for palms, mammals, and FTA
First of all, I disagree with the central premise of the paper, that trait-based approaches considering multiple trophic levels remain rare in the ecological literature. I may be biased, but I believe the research in mutualistic network ecology has been closely associated with the advancements put forward in the past decades in trait-based and functional approaches, particularly those aimed at predicting species interactions from trait linkage rules. Over the past decades, a substantial body of literature has examined how communities of interacting species assemble and disassemble as a function of species traits. This literature appears to be largely undermined here. That said, I do agree that, that “horizontal” diversity studies, are way more common than “multitrophic” diversity. But to say that they are rare, seems to be an exaggeration. And then again, all the work on horizontal functional diversity is, at least implicitly, grounded in the assumption that competition is the structurally dominant ecological interaction underlying community assembly. Moreover, functional symmetry is at least an implicit assumption in many trait-based models, and there has been some recent studies that have explicitly examined asymmetry in how traits and trophic links are organized and function in ecological networks (Zheng, et al. “Asymmetric foraging lowers the trophic level and omnivory in natural food webs.” Journal of Animal Ecology 90.6 (2021): 1444-1454.; Borzone et al. “Symmetries and asymmetries in the topological roles of piscivorous fishes between occurrence networks and food webs.” Journal of Animal Ecology 91.10 2022: 2061-2073; Hidas, A., & Jordán, F. 2025. Causal links indicating ecosystem functioning in food webs. Community Ecology, 26(3), 725-730).
In the revised Introduction, we no longer state that multitrophic trait-based approaches are rare. Instead, we explicitly acknowledge the extensive literature demonstrating how trait matching shapes species interactions and ecological network assembly across trophic levels. We clarify that the current knowledge gap is not the application of traits to multitrophic systems per se, but rather the limited understanding of how community assembly processes jointly shape functional diversity within and between trophic levels across broad spatial scales. We also expanded the Introduction to recognize recent work (including provided references) on asymmetry in ecological networks and better position functional trophic asymmetry within this existing body of research.
The methods proposed by the authors do not appear to make a direct link to actual species traits. Ultimately, the approach seems to detect differences among trophic guilds without explicitly incorporating measured species traits, as the authors show that the stochastic block model better fits the data, in comparison to the trait based models tested by the authors. This contrasts with much of the functional diversity literature cited to justify the work. A stochastic block models are defined purely by structural equivalence, it is not immediately clear whether the inferred groups correspond to distinct combinations of species traits or whether they reflect latent interaction structure unrelated to the measured traits, as the authors explicitly claim and use to infer their functional richness (for instance L 313-318). The authors also claim that their Functional Trophic Asymmetry framework could help to estimate the strength of environmental selection and trait matching. However, the manuscript does not provide evidence demonstrating that the framework can reliably recover these underlying processes. I tend to remain skeptical of new analytical frameworks that are not accompanied by a thorough assessment of their behavior, as I believe ecology currently faces an overabundance of analytical tools that are insufficiently validated.
In the revised manuscript, we substantially revised the analytical framework and removed the stochastic block model and latent interaction-guild approach. Functional richness, functional dispersion, and functional trophic asymmetry are now calculated directly from measured species traits using multidimensional trait spaces for palms and mammals. We also revised the conceptual framing of FTA to clarify that it is a descriptive metric of asymmetries in trophic functional organization rather than a direct estimator of environmental filtering or trait matching. Throughout the manuscript, we now interpret FTA as an indicator of differential responses across trophic levels, while recognizing that the underlying ecological processes require independent testing. Our implementation of FTA relies on a simple richness-constrained null model designed to provide an interpretable baseline for standardized functional diversity.
Finally, the manuscript relies on a large dataset and a complex modeling pipeline to estimate species interactions and Functional Trophic Asymmetry, which seems to be the main point of the manuscript (but see my initial concern). If introducing the FTA is the main goal of the paper, rather than the ecological association between climate and palm-mammal networks in the Neotropics, I think that this level of complexity might be obscuring this main conceptual advance. The authors compiled metawebs and downscale them to local networks using a series of models and analytical steps to detect interactions, but this complex analytical machinery may distract from the core contribution. Thus, as a suggestion, I would say that if the primary goal is to introduce and justify this new conceptual framework (considering my previous ocmments), it might be more effective to introduce it using well-sampled empirical local networks or even a controlled “toy” dataset. Figure 1: In Pij is it suppose to be a Hadamard (element-wise) product, or a standard matrix multiplication? If it is a Hadamard product, the appropriate symbol (⊙) should be used.
In the revised manuscript, we substantially simplified the analytical framework by removing the interaction downscaling component and focusing directly on the development and application of Functional Trophic Asymmetry (FTA) using trait-based functional diversity. Functional richness, functional dispersion, and FTA are now calculated directly from measured species traits rather than inferred interaction networks. This revision considerably reduces the methodological complexity and better aligns the analyses with the primary conceptual contribution of the manuscript